
Atlas of 6.3 million nuclei compares eight brain disorders
A map of the prefrontal cortex separates shared and disorder-specific signals across neurodegenerative and psychiatric diseases. The comparisons included 1,160 donors.
Leitura autorizada · 3 crédito(s) restante(s)
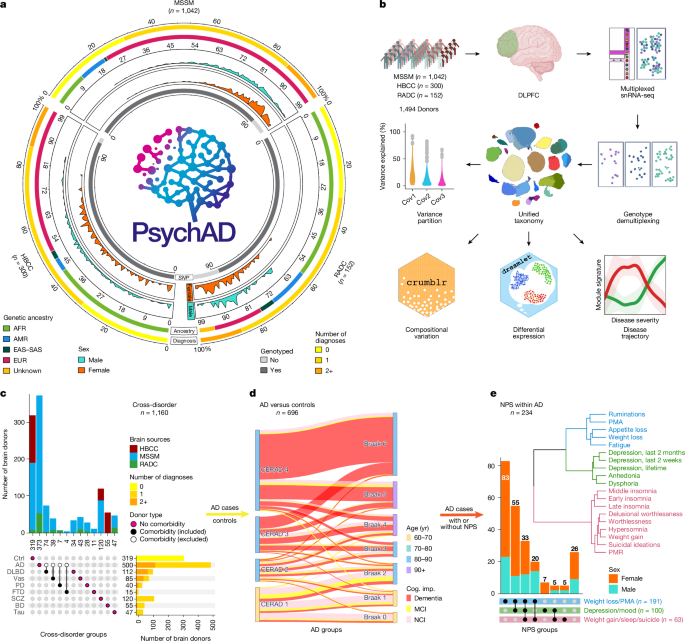
A map built from brain tissue donated by 1,494 people brought together more than 6.3 million cell nuclei and organized them into 65 subtypes. Within this full cohort, a subset of 1,160 donors—including 319 controls without the diagnoses being compared—supported the comparisons across eight disorders. The work, published on September 23 in Nature, places neurodegenerative diseases, dementias and psychiatric disorders within the same cellular reference.
The samples came from the dorsolateral prefrontal cortex, an area behind the forehead involved in planning, decision-making, working memory and regulation of behavior. The brain contains regions with different tasks and cell types, and this focus allows researchers to examine at high resolution an area relevant to several of the diagnoses. The tissue was donated after death and preserved by three collections, including the NIH NeuroBioBank and the Rush Alzheimer’s Disease Center.
Donghoon Lee, Mikaela Koutrouli, Nicolas Y. Masse and colleagues from the PsychAD consortium used single-nucleus RNA sequencing to separate signals that would be mixed together in a whole-tissue analysis. The nucleus stores DNA and some of the RNA molecules produced when a gene is in use. Measuring these RNAs shows which genetic instructions were more or less active in each cell type; the electrical impulses that allow neurons to communicate are a different phenomenon. The classification yielded eight major classes, 27 subclasses and 65 cell subtypes.
The full cohort covered donors from zero to 108 years of age, with 723 men and 771 women. More than 30%—509 people—had non-European genetic ancestry, a broader composition than that of many historical brain banks. The models separately estimated how much of the variation was associated with the cell, the donor, the diagnosis and technical factors. This adjustment reduces interference from differences such as the collection from which the tissue came, while preserving the uncertainty inherent in comparing complex biological samples.
The comparative subset included Alzheimer’s disease, diffuse Lewy body disease, vascular dementia, Parkinson’s disease, tauopathy—a condition marked by the abnormal accumulation of the tau protein—frontotemporal dementia, schizophrenia and bipolar disorder. The common reference made it possible to look first for processes recurring across several diagnoses and then for changes concentrated in one disease or one specific cell type.
The broadest similarities involved basic tasks, such as processing messenger RNA, which carries instructions from genes, and directing proteins to where they need to act. After estimating and subtracting these widespread signals, Alzheimer’s disease, Lewy body disease, vascular dementia and Parkinson’s disease formed the group with the greatest agreement in genetic and gene-activity patterns. Here, agreement means statistical similarity between patterns; each disease retains its characteristic manifestations and lesions.
In brains with more severe Alzheimer’s disease, the atlas recorded a lower abundance of neurons and a greater relative presence of immune and vascular cells. Microglia, for example, are the resident immune cells that monitor brain tissue and respond to damage. Differences between donors accounted for 7.5% of the total transcriptomic variation, that is, the variation in the amounts of RNA measured across the dataset. This number describes the sample’s molecular diversity, not a fixed share of risk or severity attributed to each person.
The atlas now provides an open catalog for locating, in defined cells, processes that merit functional testing. Next steps include determining whether the associations participate in the course of the diseases, repeating the analysis in other brain regions and tracking markers over time in living people. By organizing the path from 1,494 donors → more than 6.3 million nuclei → 65 subtypes → 1,160 participants in the comparisons, the study provides a more precise basis for selecting hypotheses, candidate biomarkers and possible research targets.
Key points
- The full cohort included 1,494 donors and more than 6.3 million nuclei; comparisons across eight disorders used a subset of 1,160 donors, including 319 controls.
- The nuclei were classified into 65 subtypes, making it possible to locate shared and specific patterns in defined cell populations.
- Differences between donors accounted for 7.5% of the total transcriptomic variation, a result that guides the design of new tests and validations.
Comments
No comments have been published yet.
Sign in with a subscription to comment.